Setting up Weighting in MagicRobot Attribution Analytics
There are 3 main styles that can be used (and in combination):
- Standard Positions and Attributes
- Attribute categories from the Pipeline Impact Split record (and therefore the parent Contact, Role, Campaign and Opportunity permutation)
- Using historic Conversion Percentages from Campaign Type to Opportunity via a Weighting Table
Standard Positions and Attributes Descriptions
Each active Model of Attribution Analytics will always set and identify Pipeline Impact Split Detail records with the following:
- • Opportunity is MQL Compliant (e.g. is “Marketing Sourced”) – this can control the overall % given to Marketing Responses
- • First Response
- • Last Response (before Opportunity Qualified / SQP)
- • Is from an MQL-Compliant Contact and the engagement’s timing is MQL-Compliant
- • Is from Post-Opportunity, i.e. is during the sales cycle, e.g. is a “Closer” type Split
- • “Notable” which gives you the opportunity to indicate with a custom checkbox field filled via Flow
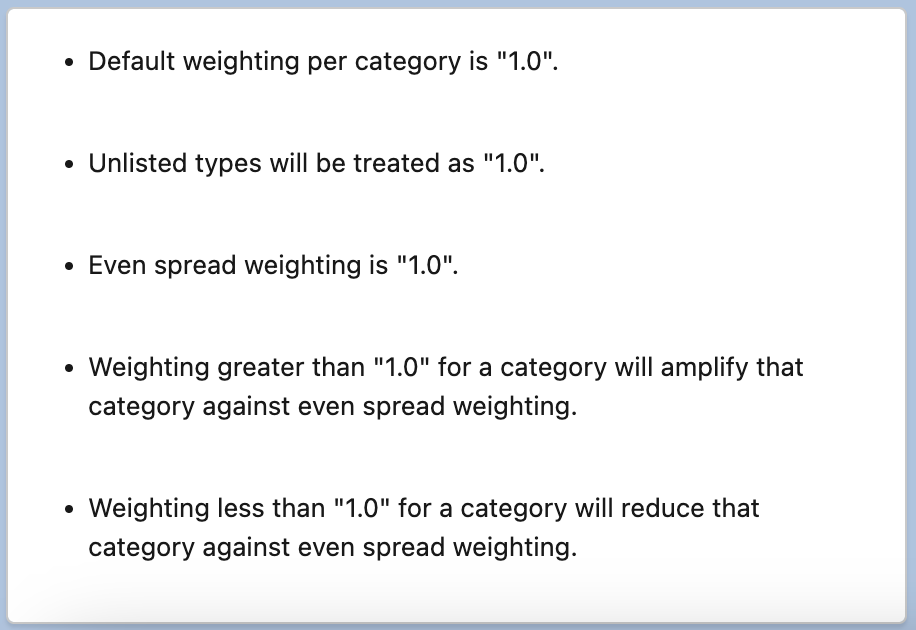
- • “Leftovers” which will apply even-spread attribution to all remaining Splits that didn’t fall into any of the aforementioned categories.
You’ll see that each Model enables the application of a specific % to each of those categories where null / blank values will be ignored.
The application will examine the order you indicate they be processed in, for each model with Weighting Active. If Splits are found to be compliant with the category, the % will be applied to all splits in that category. Remaining percentages will then be applied to subsequent categories. For example, if First Response and Last Response give out 40% total, the remaining 60% will be applied to the next category (where 100% will give out that 60%)
Navigate to Edit Advanced Settings Tab
In the settings, you will see each model available for weighting will have the same set of settings that can be configured to the needs of weighting for that model, each of which run in parallel.
![]()
Using Standard Positions and Attributes style of Weighting
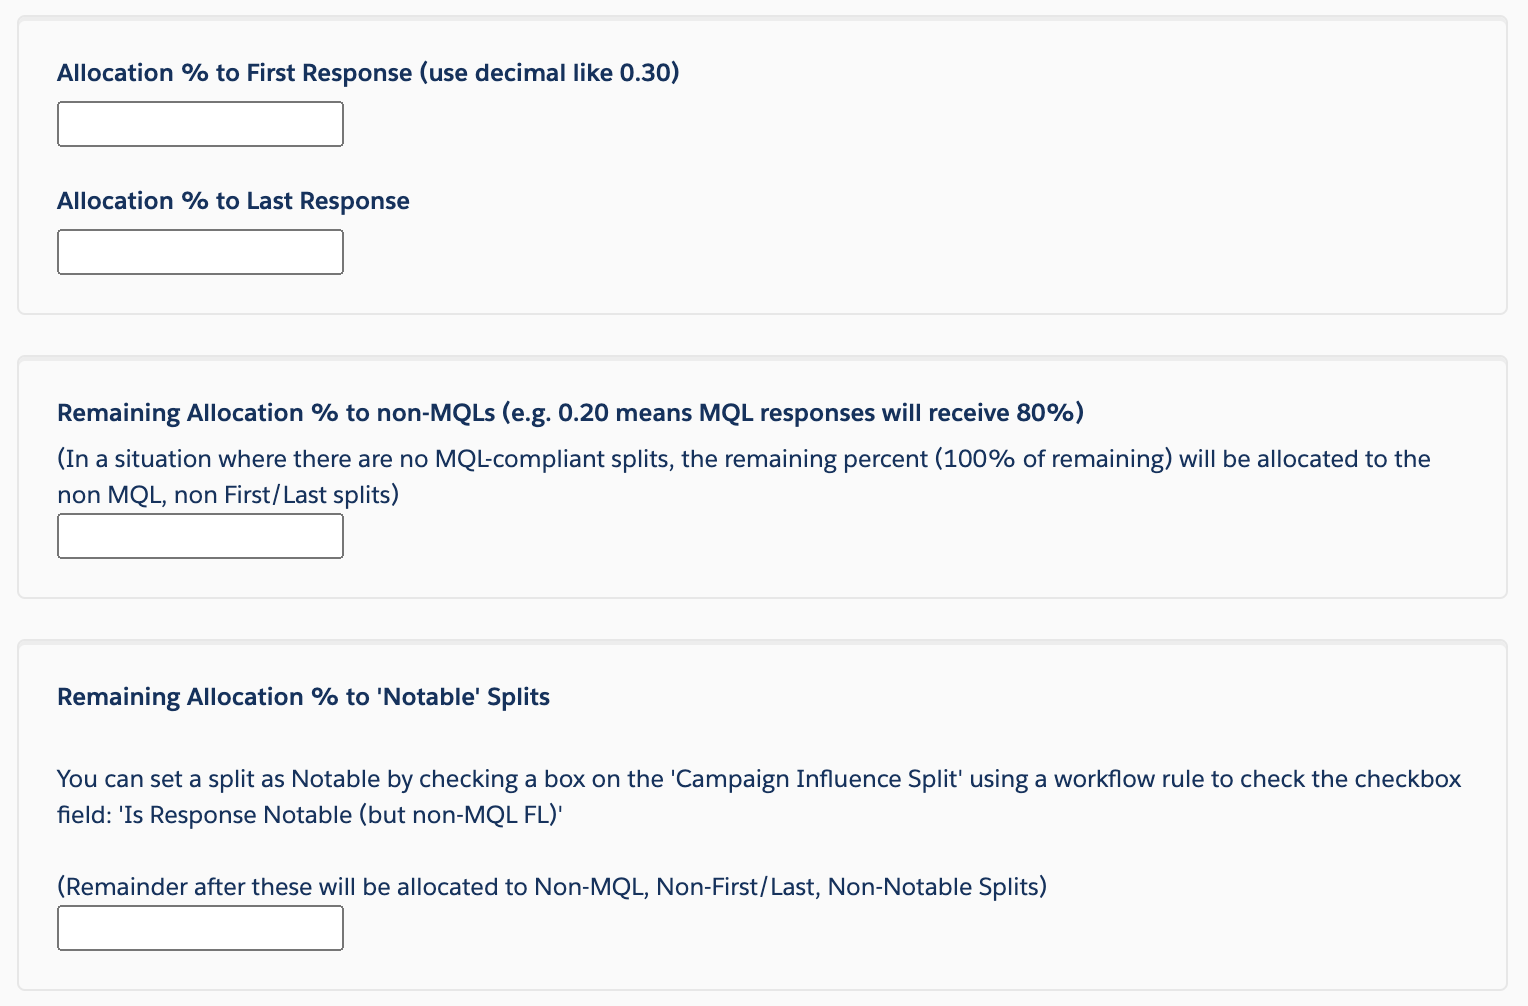
Within each model you will see the following options.
You must set a % for the Opportunity Given to Non-MQL & Non-Marketing Sourced Opportunities. The default is 100% which means that all 100% of the Opportunity will be spread among all the Pipeline Impact Splits.
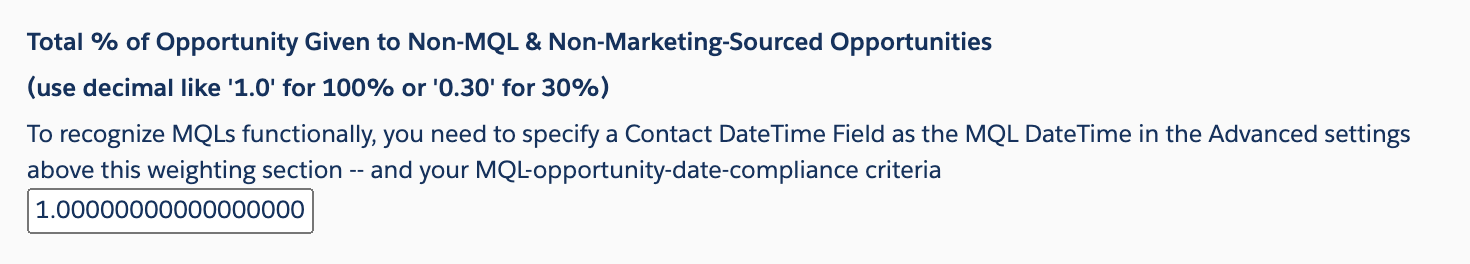
However, you can lower this percentage (especially if you don’t have any Campaign Members from non-Marketing Campaigns) to cap the attribution given out if the Opportunity doesn’t meet the MQL or Marketing Sourced Criteria — for example 70%. That means the starting value to allocate to the influencing splits will be 70%, because it has been identified that the Opportunity was not sourced by Marketing.
In conjunction with the MQL awarding evaluation, which if met will win all, you can also specify lead sources which definitely mean the Opportunity was NOT sourced by Marketing. In other words, if the Opportunity is not MQL-compliant, and the Lead Source is Definitely NOT marketing, then the % indicated above will be awarded to the influencing splits. To list out Lead Sources definitely NOT marketing, fill this field:

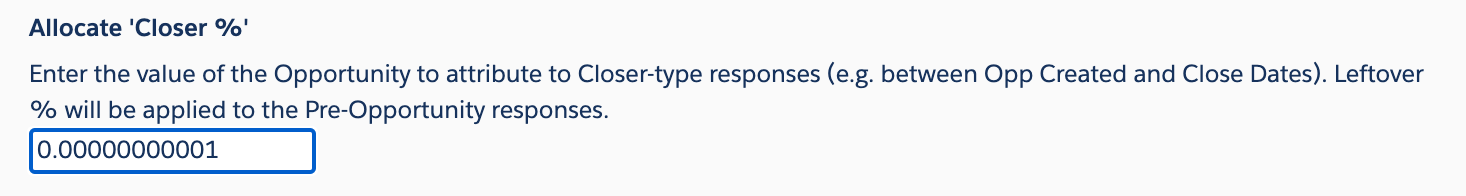
Next, if you want to set a specific percentage to Post-Opp / Sales Cycle / Closer Splits, set it here. A blank value will give out even spread attribution as with all the other “Leftovers”
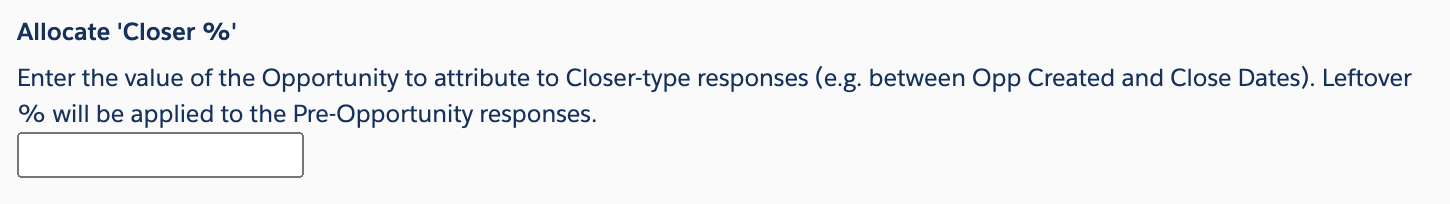
In a full-path type of model (on the Full Path model, or if active on “Client Custom” or “Magic Model” you can align the % with a Pre-Opp-only style model, while still giving visibility to influencing splits from the sales cycle, you can set a very, very low percentage, like this:
Next, if you want to use both MQL-Compliant weighting for each split AND Positional weighting, you can decide to ensure the Positions of First and Last Response are allocated before the MQL-compliant splits by checking this box:

Using Split Attributes (AKA “A-B-C Notables”) style of Weighting
This Style relies on creating Salesforce Flows to update the Pipeline Impact Detail Split records with a checkbox into categories of one of “A”, “B”, “C” or Notable.
This is most often selected when wanting to weigh down and cap the influence of a specific type of engagement, like “Email Opens” for example.
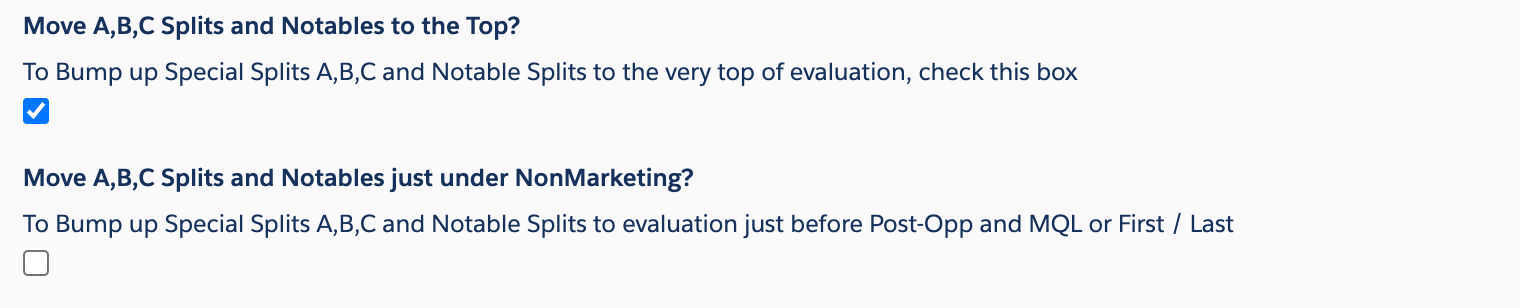
These two controls enable you to set where you want these percentages evaluated against the Position & Attribute settings. For example, checking the box like below moves the evaluation for A-B-C-Notables all the way to the beginning:
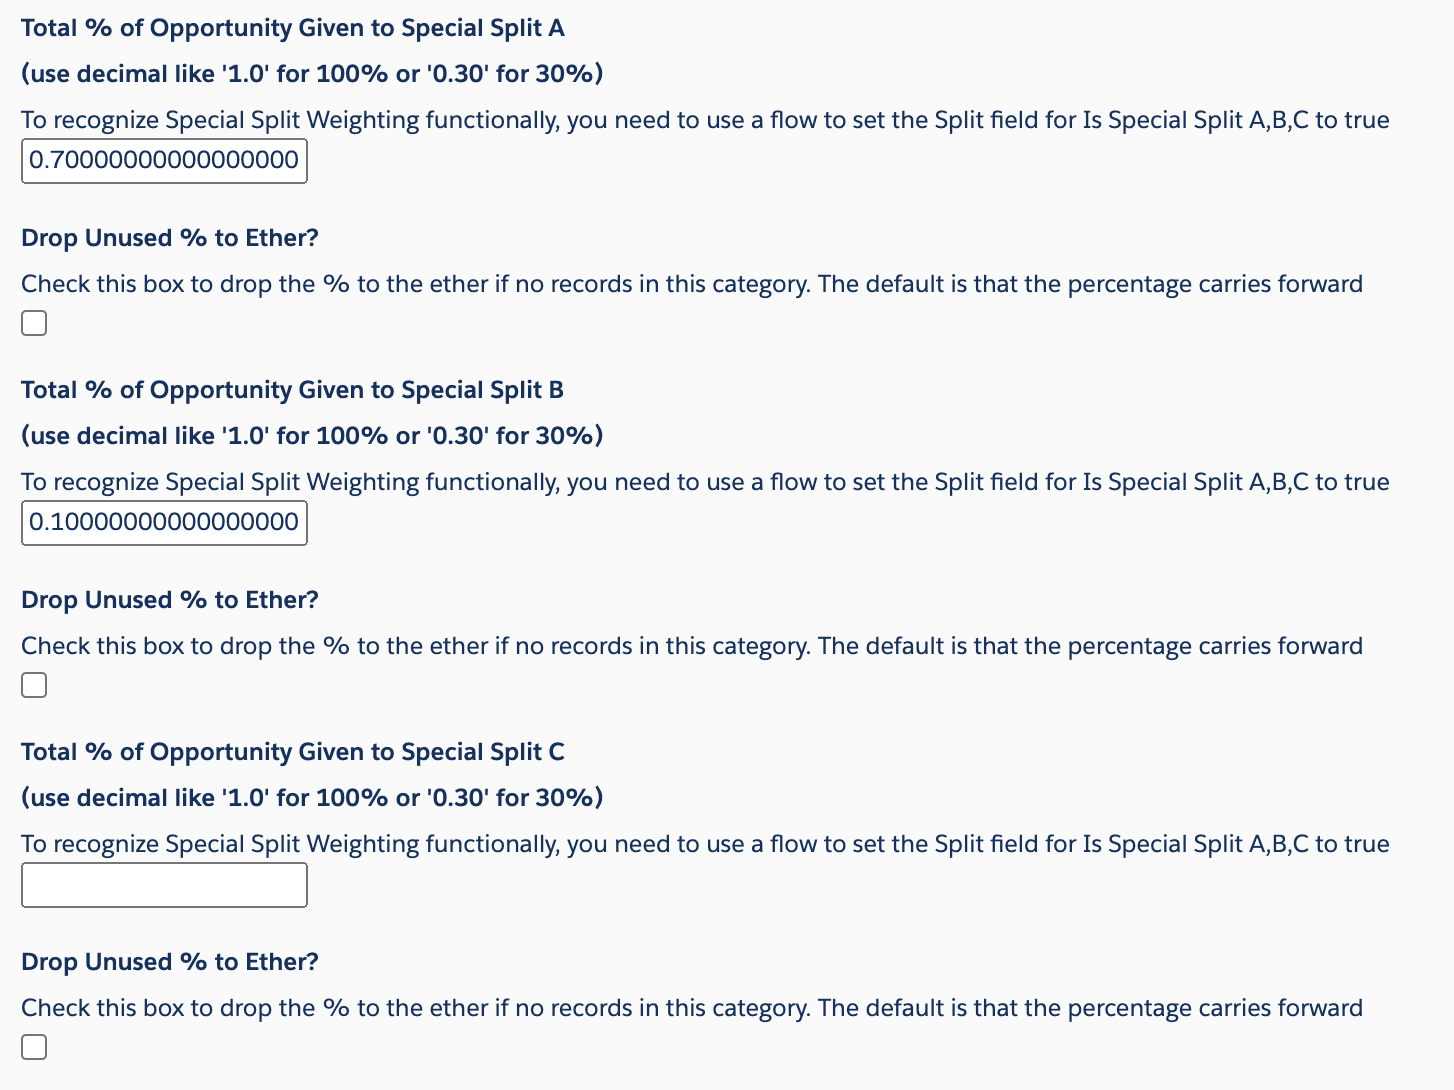
The below configuration ensures 70% be given among all splits with the Checkbox checked for “Special Split Type A”, like maybe if the Contact Role is “Executive Sponsor” or the Campaign Type is “Event”. Where 10% to Split Type B might be for “Email Open” Campaign Type of Split. (Again, Salesforce Flows should be used for the Pipeline Impact Split object to set these)
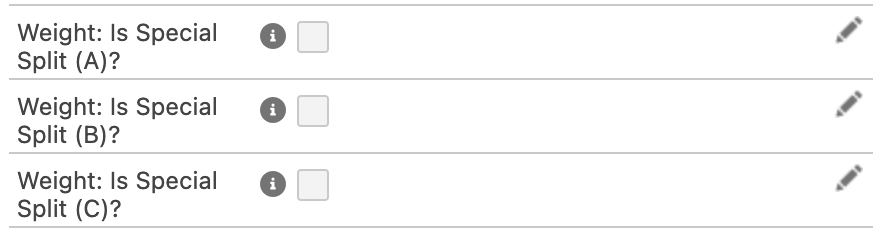
These are the fields on the Pipeline Impact Detail Split to set via Flow, in accordance with the settings selected above.
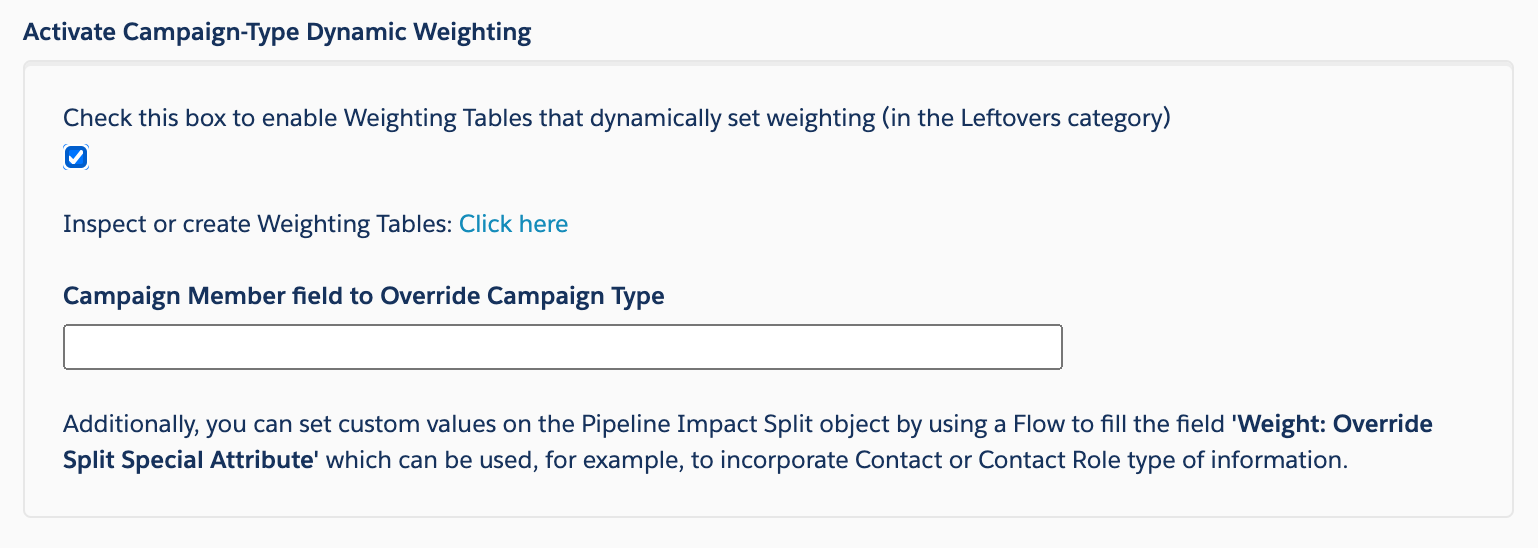
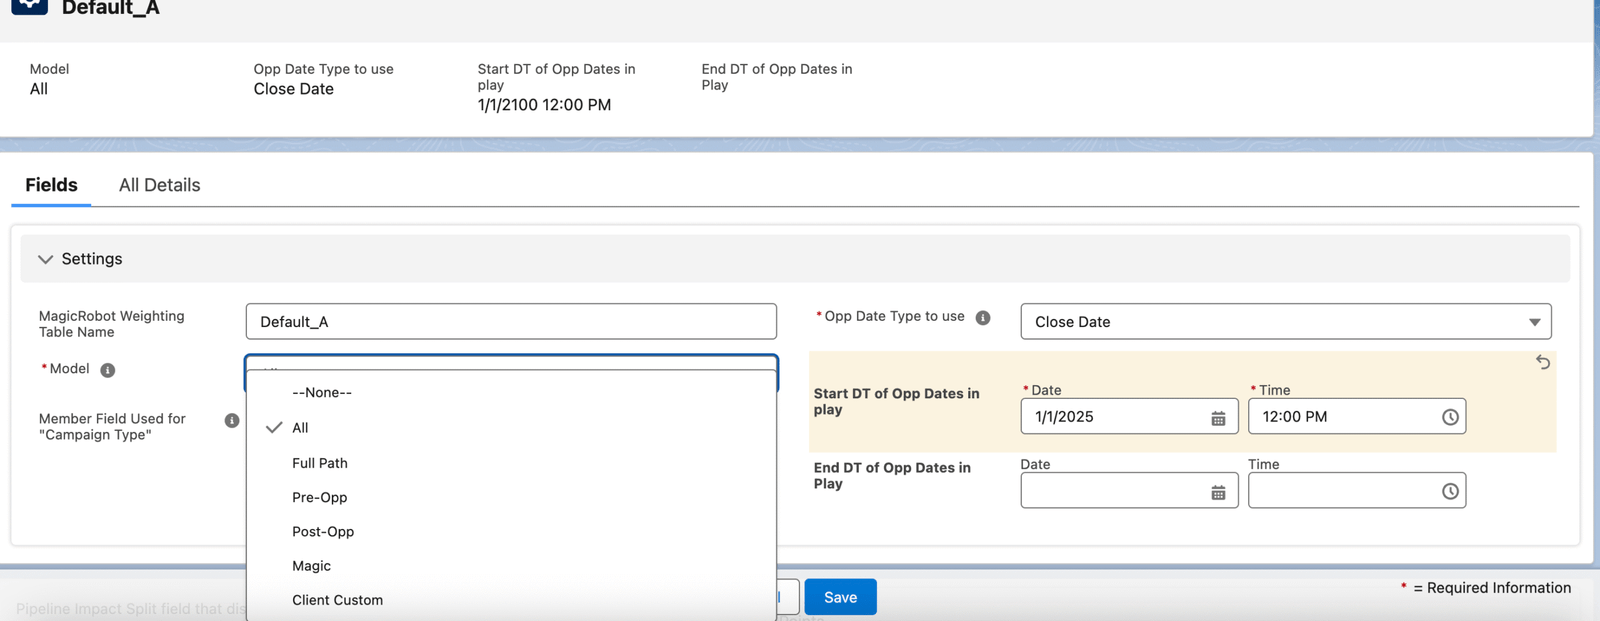
Using Weighting Tables style of weighting
Of course you can use this functionality in a number of different ways to accomplish dynamic weighting goals, however, it’s designed to enable you to utilize the historic conversion percentage of Campaign Type from Response to Opportunity Win %. This style enables you to exactly control the Weighting directly based on data, moving the decisions away from the arbitrary.
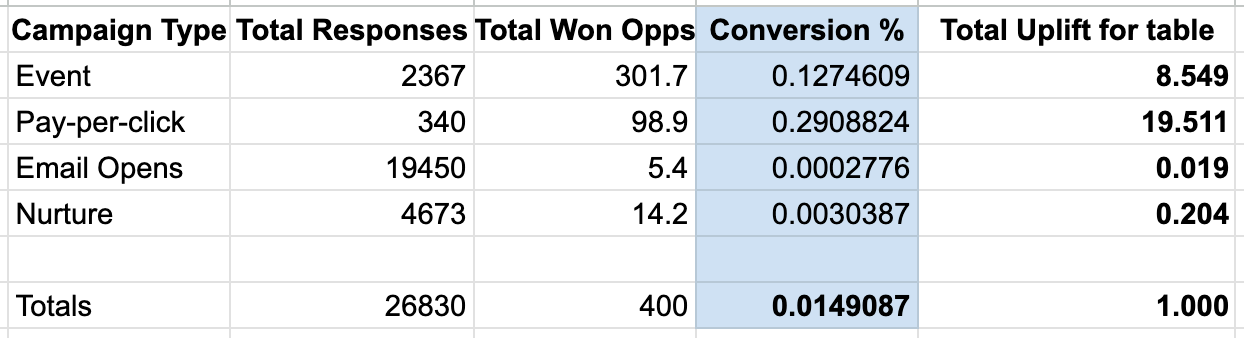
Here is an example of how to calculate the uplift coefficient for the weighting table, based on historic conversions – where the number to use is the last column which is calculated by dividing the overall conversion percentage by the value of the row / category’s conversion percentage:
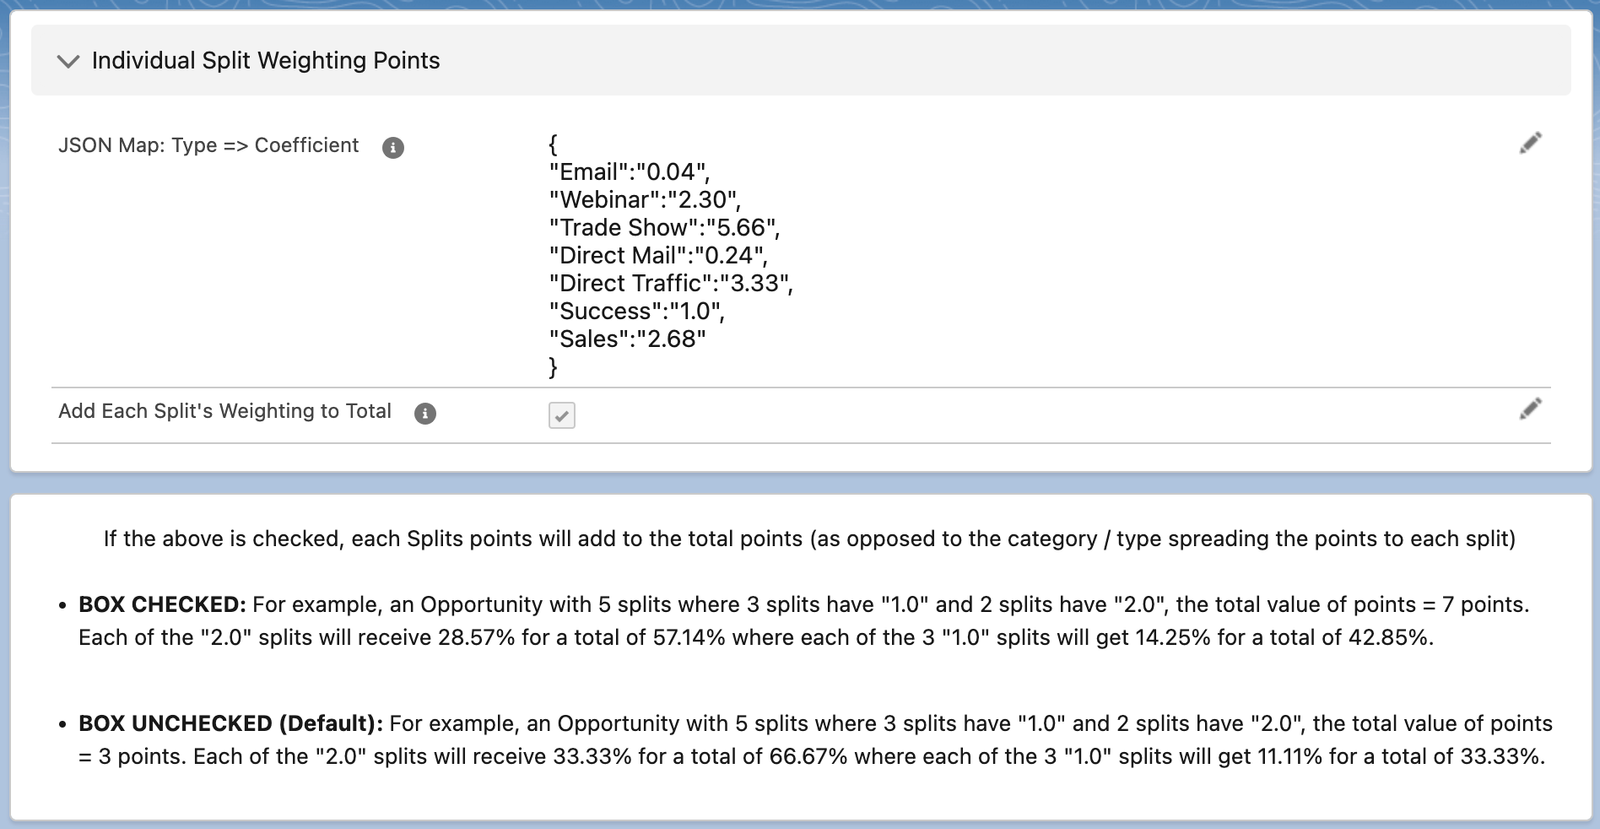
Here is example / template JSON to indicate the values to use in the Weighting Table record inside the application:
{
“Email”:”0.04″,
“Webinar”:”2.30″,
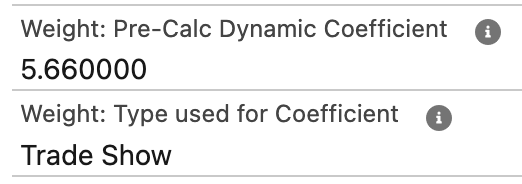
“Trade Show”:”5.66″,
“Direct Mail”:”0.24″,
“Direct Traffic”:”3.33″,
“Success”:”1.0″,
“Sales”:”2.68″
}
Here’s an example of an output using the above weighting:
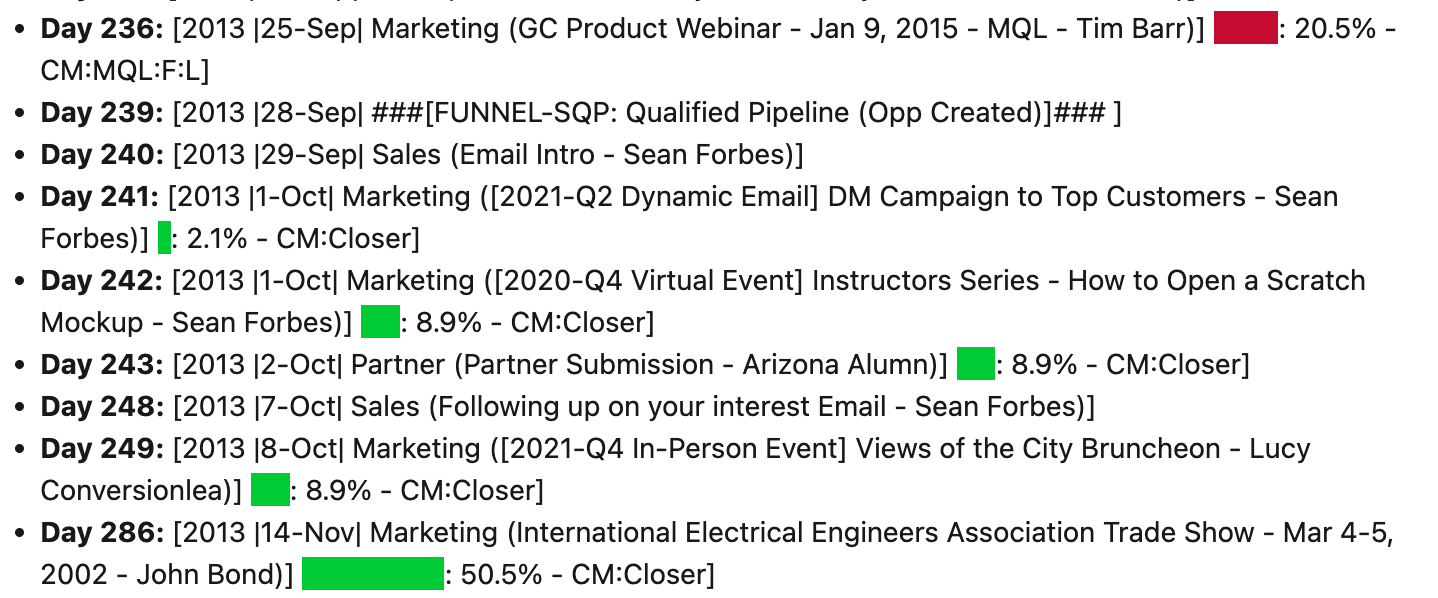
Where the Opportunity X-Ray had this information: 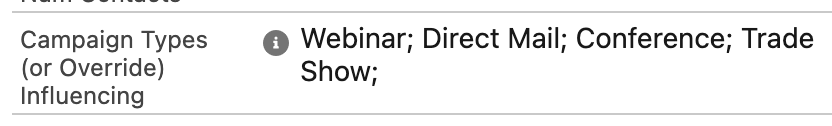
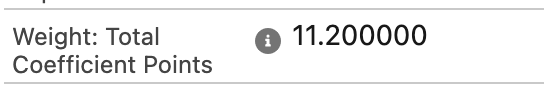
Where the first split had these details:
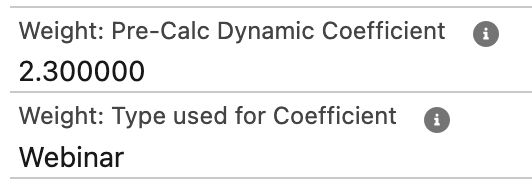
Where the second split 2.1% had these details: 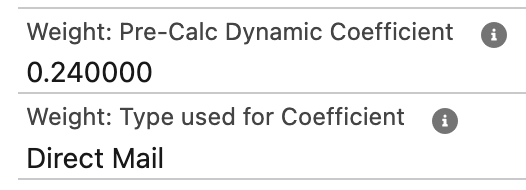
Where the final split had these details: